TL;DR — The final diagram is the densest of all: the ~150 tools from Brendan Gregg's book BPF Performance Tools: Linux System and Application Observability (2019) — prior tools in black, dozens of brand-new ones in red. It's not a toolbox to memorise; it's a catalogue proving eBPF reaches every corner of the system. This finale tours the new tools by subsystem (the deeper file/scsi/nvme/socket/page-fault tracers), distils the book's methodology (USE, off-CPU analysis, the checklist), and — since this closes the series — ties all nine chapters into one coherent way of working.
The book, and why this diagram is different
The first eight chapters mapped tools you run. This one maps a book — 880 pages that are the definitive reference for performance analysis with eBPF. The diagram shows everything: the prior tools from BCC/bpftrace (black) plus the many new tools Gregg wrote for the book (red), pinned across the whole system. The point of looking at it isn't to learn 150 commands. It's to internalise one fact: there is no layer of Linux that eBPF can't observe. File internals, SCSI and NVMe device latency, individual socket operations, page-fault types, scheduler internals, even hypervisor exits — each got a tool. The black-and-red split tells the story of how fast the field matured: a single book roughly doubled the catalogue.
So we'll treat this as a reference tour. We won't re-explain tools covered in Parts 7–8; we'll highlight the new depth the book added, grouped by subsystem, then step back to the methodology that makes any of it useful — because 150 tools without a method is just noise.
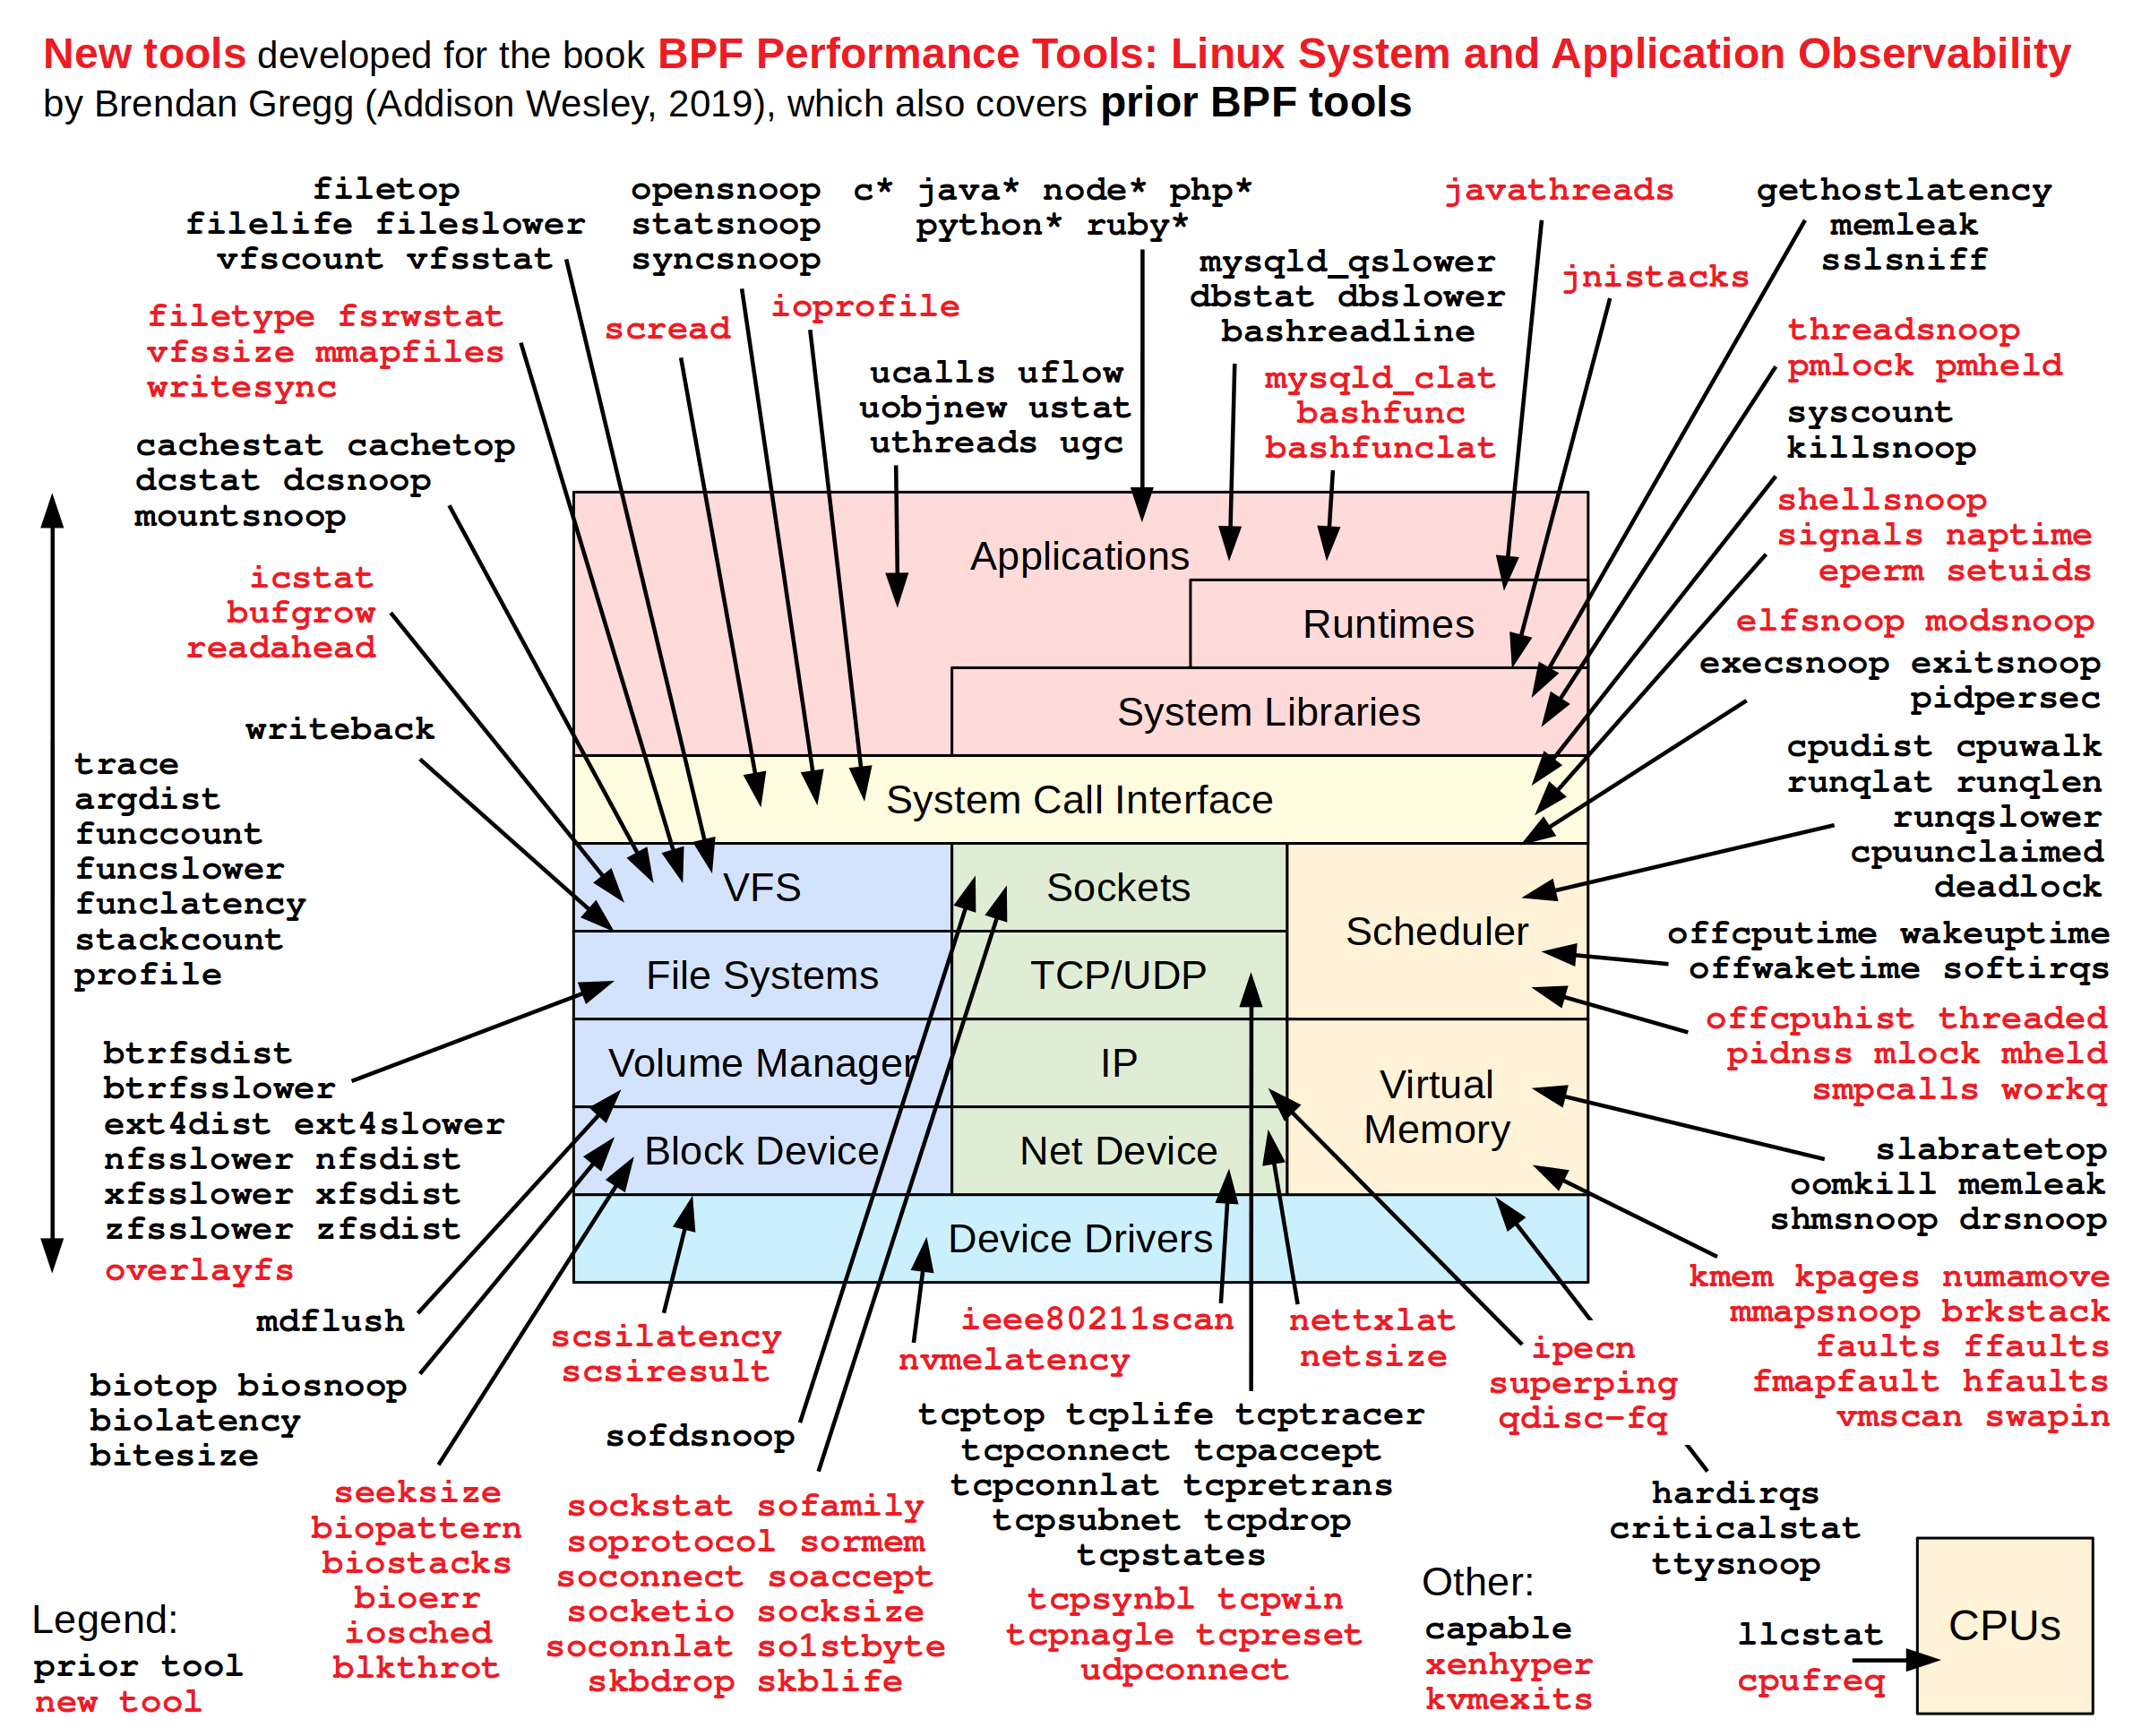
The original — Brendan Gregg's "BPF Performance Tools" book diagram (brendangregg.com, 2019). The simplified diagram below highlights the new depth.
Fig 1 — A slice of the book's catalogue. The new (red, in the original) tools added depth at every layer — file internals, device-specific latency, socket-level detail, fault types.
Files: from "which file" to "what kind, what part"
Parts 7–8 told you which file and how slow. The book's new file tools tell you what type and what part:
| Tool | What it adds |
|---|---|
filetype | I/O broken down by file type (regular, socket, fifo…) and operation |
fsrwstat | VFS read/write stats by filesystem type — compare ext4 vs xfs vs tmpfs traffic |
vfssize | distribution of VFS I/O sizes — tiny vs large operations |
scread | traces reads via the read() syscall path specifically, with filename |
readahead | traces kernel read-ahead — how much prefetched data was actually used (or wasted) |
mmapfiles / fmapfault | memory-mapped file usage and their page faults |
writesync / filelife | sync-write behaviour and file lifespans |
readahead is a quietly brilliant addition: it measures whether the kernel's prefetching helps or wastes I/O for your access pattern — read-ahead is great for sequential scans but pure overhead for random access, and this tool quantifies the trade-off you're actually getting.
Storage: down to the device protocol
The biggest new depth is in storage — the book added tools that reach into the SCSI and NVMe layers and characterise the I/O pattern, not just its latency.
| Tool | What it adds |
|---|---|
biopattern | identifies random vs sequential I/O ratio — the access pattern, automatically |
biostacks | block I/O with the full kernel stack that issued it — who caused the I/O |
bioerr | traces block I/O errors — failing device, before it fully dies |
seeksize | distance between consecutive I/Os — seek behaviour on spinning disks |
scsilatency / scsiresult | SCSI command latency and result codes — device-protocol level |
nvmelatency | NVMe device command latency — the modern flash equivalent |
iosched / blkthrot | I/O scheduler latency / block cgroup throttling — is the kernel delaying I/O? |
biostacks closes a gap that haunts storage debugging: biolatency says I/O is slow, but what issued it? Asynchronous writeback and readahead detach the I/O from the original caller, so the obvious process is often innocent. biostacks captures the full stack at issue time, naming the real origin. And blkthrot catches the case where the disk is fine but a cgroup I/O limit (common in containers/Kubernetes) is throttling you — a "slow disk" that's actually a policy.
Network: per-socket and per-packet detail
The network section explodes with new tools — a whole family of socket-level (so*) and TCP-internal tracers.
| Tool | What it adds |
|---|---|
soconnect / soaccept / soconnlat / so1stbyte | socket connect/accept events, connect latency, and time-to-first-byte |
socketio / socksize / sormem | per-socket I/O counts, sizes, and receive-buffer usage |
sofamily / soprotocol | socket families/protocols in use — what's actually talking |
tcpwin / tcpnagle | TCP congestion-window dynamics / Nagle-algorithm delays |
tcpsynbl / tcpreset / tcpsubnet | SYN backlog, resets sent, traffic by subnet |
skbdrop / skblife | socket-buffer drops / lifespan — packet loss inside the stack |
nettxlat / netsize / ipecn / qdisc-fq | transmit latency, packet sizes, ECN, fq-qdisc behaviour |
so1stbyte and soconnlat are gold for service latency: they split connection setup from time-to-first-byte, so you can tell a slow handshake (network/DNS) from a slow server response (app/DB) — a distinction APM often blurs. tcpnagle catches the infamous Nagle/delayed-ACK interaction that adds tens of milliseconds to small request/response traffic, a classic invisible latency bug.
Memory & faults: typed page faults
| Tool | What it adds |
|---|---|
faults / ffaults / hfaults | page faults overall / by file / by process — where memory pressure bites |
vmscan | kernel page-reclaim activity — the work behind memory pressure |
swapin | which processes are swapping back in — paging pain, per process |
numamove / kmem / kpages | NUMA page migration / kernel memory allocation detail |
mmapsnoop / brkstack | mmap events / heap-growth stacks — allocation hotspots |
vmscan and swapin are the deep-dive for the memory-pressure incident: when free looks tight and latency rises, vmscan shows the kernel burning CPU reclaiming pages and swapin names the process paying for it. numamove exposes the kernel automatically migrating pages between NUMA nodes — useful work that can also thrash, tying back to the placement tuning of Part 4.
Scheduler & CPU internals
| Tool | What it adds |
|---|---|
runqslower | per-event run-queue waits over a threshold — name the threads that waited too long |
cpufreq | CPU frequency sampled per process — is your code running at full clock? |
smpcalls / workq | cross-CPU function calls / work-queue latency — kernel scheduling internals |
offcpuhist / threaded | off-CPU time as a histogram / per-thread CPU behaviour |
pmlock / pmheld / mlock / mheld | lock acquisition latency and hold time — contention, measured directly |
runqslower turns Part 1's runqlat histogram into named events: instead of "some threads waited 5ms," it prints which thread waited and how long — the actionable version. And the lock tools (mlock/mheld) measure mutex acquisition latency and hold time straight from the kernel, turning "I think there's lock contention" into a number — the off-CPU story made concrete.
Applications, security & virtualization
The edges add tools for runtimes, security events, and even the hypervisor:
- Runtimes:
threadsnoop(thread creation),mysqld_clat(MySQL command latency),javathreads,jnistacks— deeper than Part 7'su*family. - Process/security:
elfsnoop(ELF binary execs),modsnoop(kernel module loads),exitsnoop(process exits + reason),signals,setuids,eperm(permission denials),shellsnoop— observability that doubles as security monitoring. - Virtualization:
xenhyper,kvmexits— trace hypervisor exits, the overhead of running virtualized.kvmexitsshowing frequent exits explains mysterious VM slowness invisible from inside the guest.
exitsnoop deserves a mention: it traces every process exit with its exit code and signal — the companion to execsnoop, and the fast way to catch processes dying unexpectedly (a worker silently exiting with a non-zero code that nobody logged).
The method behind the catalogue
The book's real lesson isn't the tools — it's the methodology that decides which to run. It formalises what this whole series has used:
- The USE method (Part 1) — Utilization, Saturation, Errors per resource — to localise.
- Workload characterisation — who is doing what to the system (which processes, which I/O pattern via
biopattern, which syscalls). - Off-CPU analysis — the insight that latency is on-CPU (profile) or off-CPU (waiting), and you must measure both. The
offcpu*,mlock/mheld, and wakeup tools exist to chase the off-CPU half. - Drill-down — start with a counter or histogram, descend to per-event tracing only on the hot path, to keep overhead low.
That's the throughline of the series: a counter localises, a histogram shows the shape, a per-event tracer names the cause — and you always know which resource and which half (on/off-CPU) you're chasing. The 150 tools are just the descent made specific.
The Linux Performance series — all nine chapters
- Observability Tools — find the bottleneck (live).
- Static Tools — check the config (at rest).
- Benchmark Tools — measure the ceiling (active).
- Tuning Tools — turn the knobs (carefully).
- sar — remember what happened (historical).
- perf-tools — trace with no dependencies (ftrace).
- bcc/BPF Tools — the eBPF toolbox.
- bpftrace — write your own one-liners.
- BPF Performance Tools — the full catalogue + method (you are here).
Hands-on: the deeper tools that close real gaps
The book's new tools answer questions the earlier toolboxes couldn't. Each example: command, output, decision. Most ship as bpftrace scripts in the book repo; all need root and a recent kernel.
Who actually issued that slow I/O?
sudo biostacks.bt # block I/O latency WITH the issuing stack@usecs[
blk_account_io_start
submit_bio
ext4_writepages
wb_workfn <- kernel writeback, not the obvious process
]:
[16K, 32K) 210 |@@@@@@@@@@@@@@@@@@@@@@|Read it: biolatency says I/O is slow; biostacks says writeback issued it, not the process you suspected — async writeback detaches I/O from its caller. Do this: tune dirty-page writeback (vm.dirty_ratio) rather than chasing the wrong process.
Random or sequential? (the access pattern, automatically)
sudo biopattern.bt%RND %SEQ COUNT KBYTES
92 8 4021 32168 <- 92% randomRead it: 92% random I/O — brutal on spinning disks, and a hint of missing indexes or a bad access pattern even on SSD. Do this: add indexes / improve locality, or size storage for random IOPS not sequential throughput.
Slow handshake or slow server?
sudo soconnlat.bt        # connection setup latency
sudo so1stbyte.bt        # time from connect to first byte back
# soconnlat: mostly < 1 ms (handshake is fine)
# so1stbyte: p99 = 240 ms (server is slow to respond)Read it: setup is fast but first-byte is slow — the network/DNS is fine, the server (app or DB) is the latency. This split is exactly what APM often blurs. Do this: profile the server, not the network.
Memory pressure — who's paying for it?
sudo vmscan.bt           # kernel page-reclaim activity
sudo swapin.bt           # which process is swapping back in
# vmscan: direct reclaim firing repeatedly (CPU burned reclaiming)
# swapin: postgres 12043 <- postgres paying the swap-in costRead it: the kernel is in direct reclaim and Postgres is swapping back in — memory is over-committed and the DB pays. Do this: cap the memory hog, lower swappiness (Part 4), add RAM.
Name the threads that waited too long for a CPU
sudo runqslower 10000 # run-queue waits over 10 ms (microseconds arg)TIME COMM PID LAT(us)
03:14:02 postgres 1843 18402 <- waited 18 ms for a CPU
03:14:02 node 9012 11240Read it: turns Part 1's runqlat histogram into named events — which thread waited and how long. Do this: CPU is saturated; reduce concurrency or pin the latency-sensitive process to dedicated cores.
Disk fine but I/O throttled? (containers/k8s)
sudo blkthrot.bt # block cgroup throttling events@[cgroup: /kubepods/burstable/pod-abc]: 4120 throttle eventsRead it: the device is healthy but a cgroup I/O limit is delaying this pod — a "slow disk" that's actually a policy. Do this: raise or remove the blkio/io.max limit on that cgroup.
Takeaways
- eBPF reaches everywhere. The book's ~150 tools prove there's no layer — file internals, device protocols, socket ops, fault types, hypervisor exits — that you can't observe.
- New depth worth knowing:
biostacks(who issued the I/O),biopattern(random vs sequential),so1stbyte(setup vs response latency),vmscan/swapin(memory pressure),runqslower+mheld(named scheduler/lock waits),blkthrot/kvmexits(hidden throttling). - The catalogue needs a method. USE → workload characterisation → off-CPU analysis → drill-down. Tools without method are noise.
- The whole series in one line: observe → static → benchmark → tune, then trace ever deeper with ftrace, BCC, bpftrace, and the book's tools.
- Counter → histogram → per-event. Localise cheap, then descend only on the hot path. That discipline is the point.
References
- BPF Performance Tools (book site) — the source of this diagram and the full catalogue.
- bpf-perf-tools-book (code) — every new tool's source.
- Brendan Gregg — Linux Performance — the home of all nine diagrams.
Extra reads
- Part 1 — Observability Tools — start the series over with the method in mind.
- eBPF for Database Troubleshooting — the method applied end-to-end on PostgreSQL.
- AMD EPYC Turin Tuning Guide — what to do once you've found the bottleneck.
Built from Brendan Gregg's "BPF Performance Tools" book diagram (2019, Addison-Wesley). Tool availability depends on kernel version and the bpf-perf-tools-book repo; many tools are bpftrace scripts requiring a recent kernel. This closes the nine-part Linux Performance series.