TL;DR — Brendan Gregg's famous "Linux Performance Observability Tools" diagram overlays dozens of tools onto a map of the system — from applications down to disks and DRAM. This chapter walks the whole map, layer by layer, so each tool stops being a name you half-remember and becomes a tool you reach for on purpose. We go subsystem by subsystem: applications & syscalls, the VFS/filesystem stack, the full network stack, CPU & scheduler, virtual memory, the block/disk path, and hardware counters — then tie them together with the USE method so you always know which box to open first.
The map, and why it exists
Performance work fails most often not because the right tool didn't exist, but because nobody knew it existed. Linux ships an absurd number of observability tools, scattered across packages, man pages, and tribal knowledge. Gregg's diagram solves that by drawing the system as a stack — applications at the top, hardware at the bottom — and pinning each tool to the exact layer it observes. If you can picture where a problem lives, the diagram tells you what to run.
This chapter is a guided tour of that diagram. The goal isn't to memorise flags; it's to build the mental index: "disk latency → block layer → biolatency," "thread won't get a CPU → scheduler → runqlat," "connection drops → TCP → tcpretrans." Once the map is in your head, every future incident starts with a layer, not a guess.
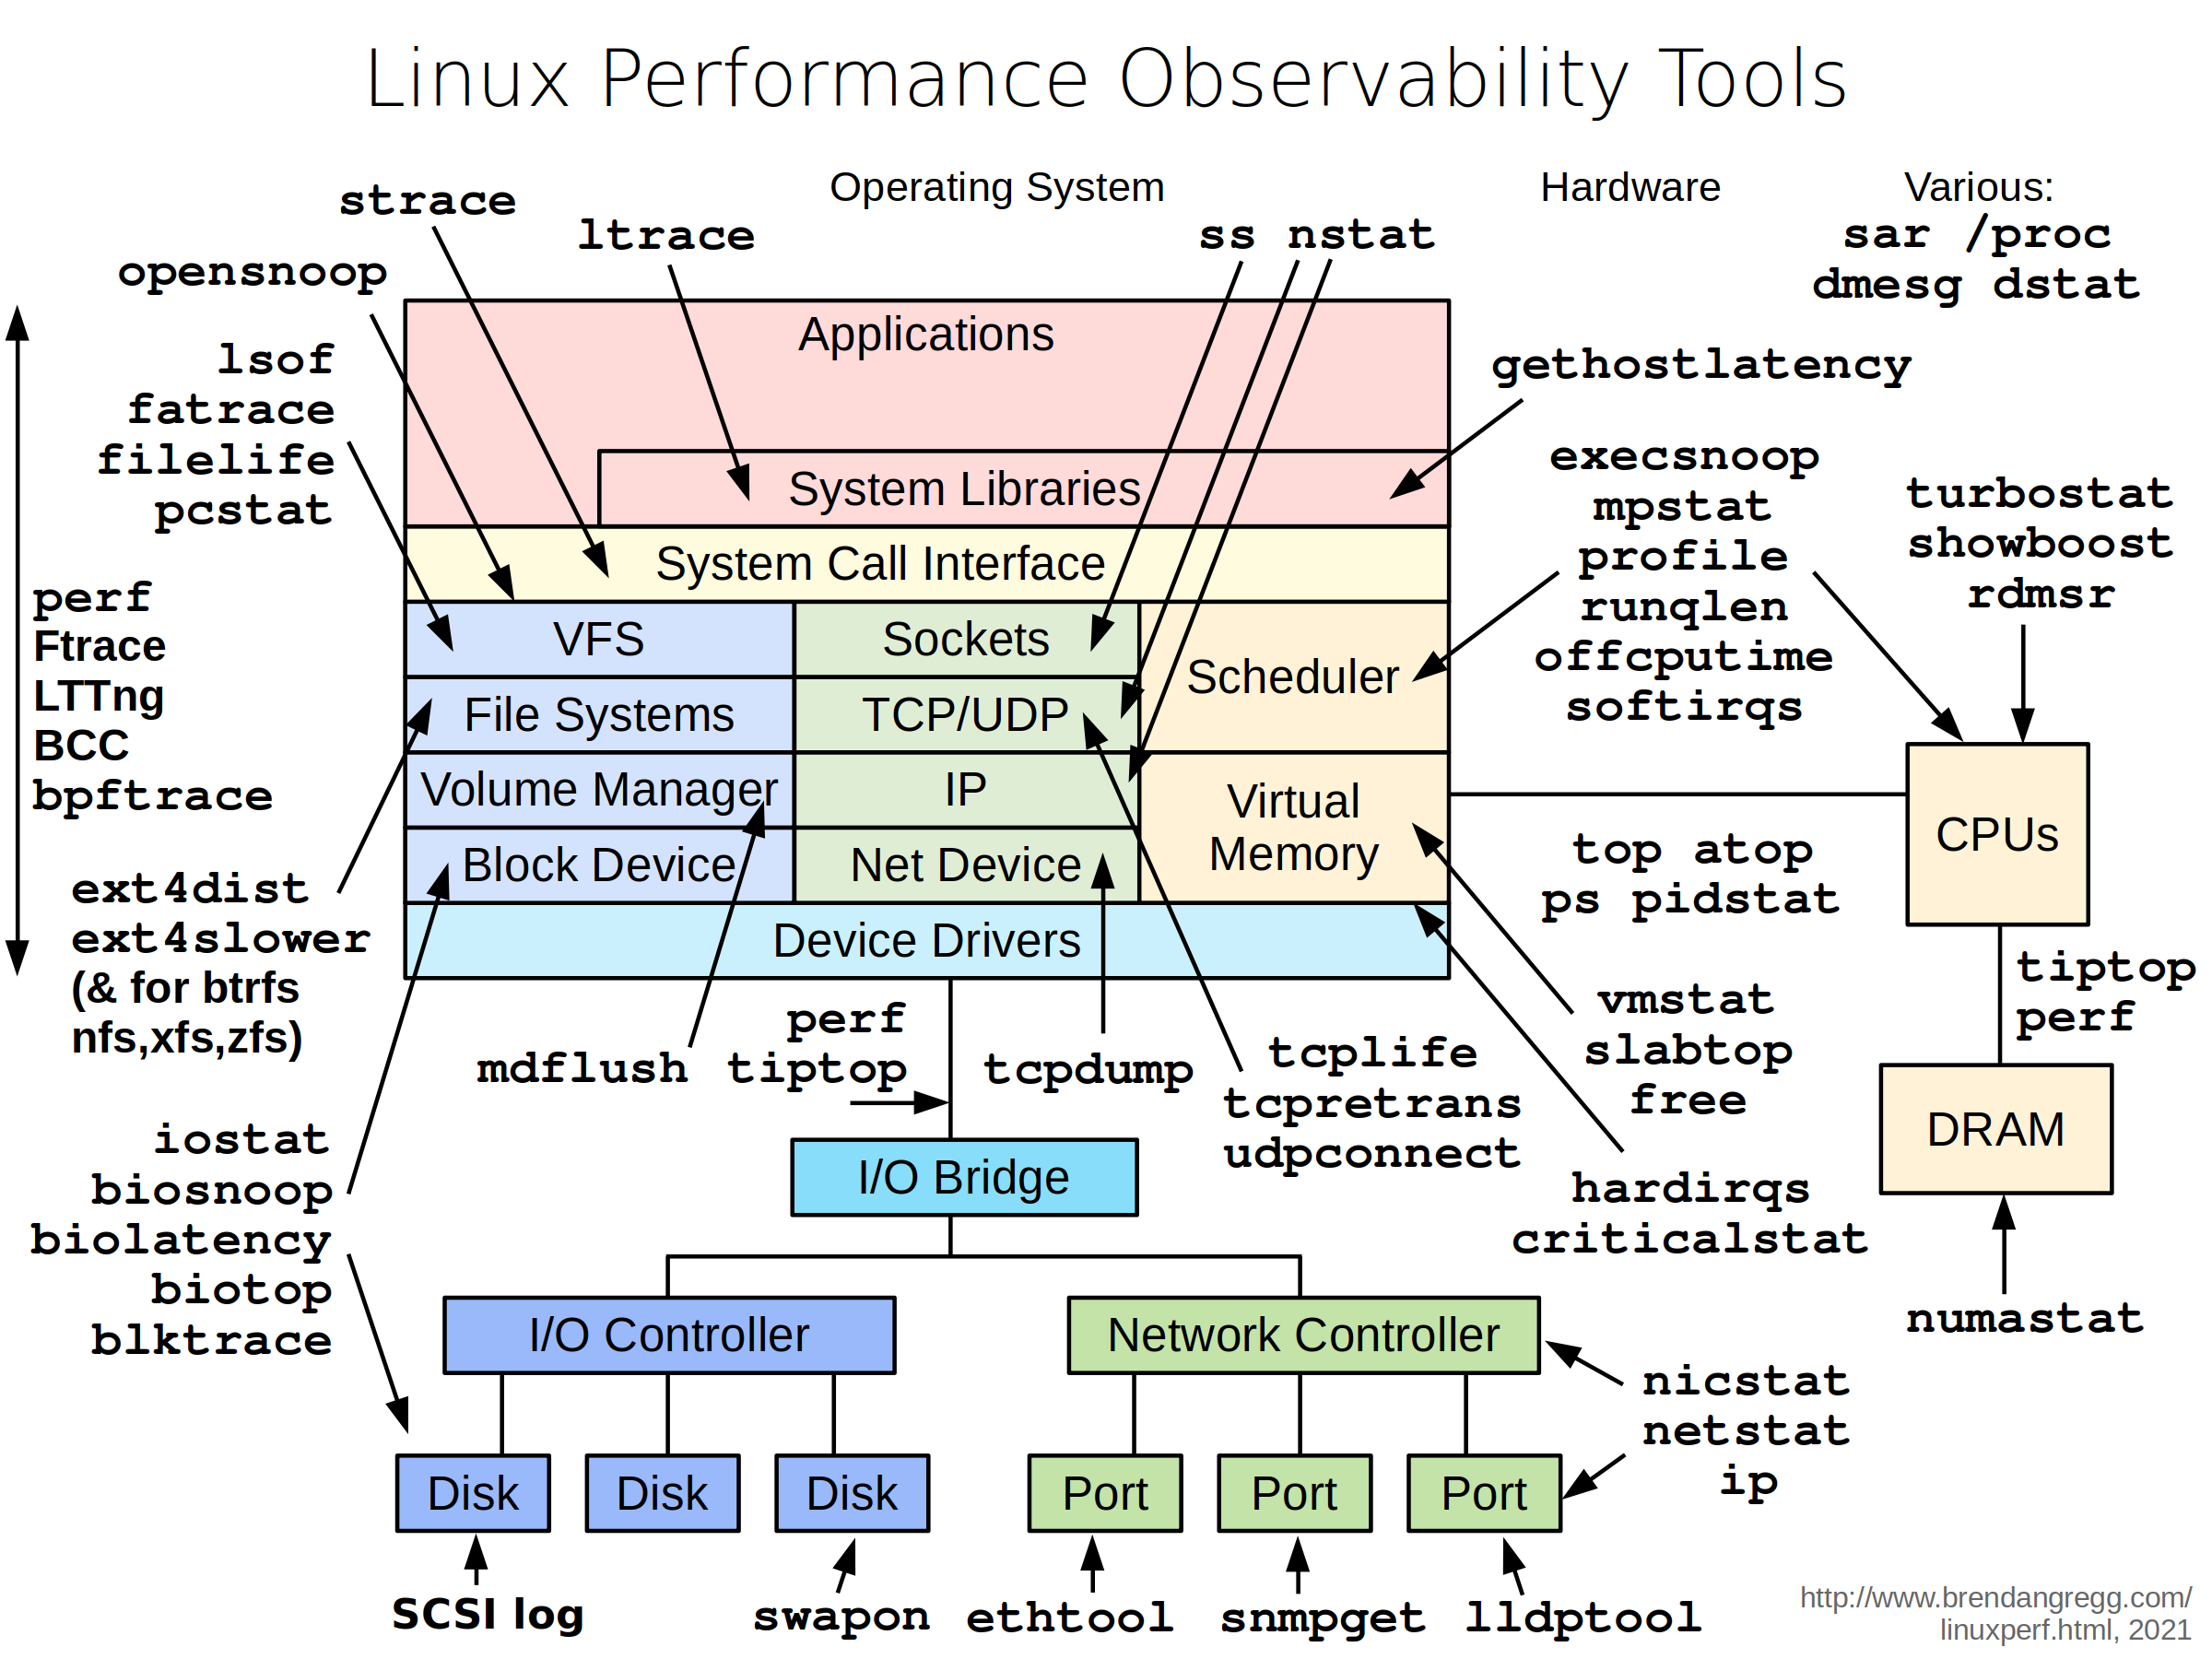
The original — Brendan Gregg's "Linux Performance Observability Tools" (brendangregg.com, 2021). The simplified diagram below walks it box by box.
Fig 1 — The system as a stack. Every observability tool pins to one of these layers. The left-side tracers (perf, Ftrace, BCC, bpftrace) can reach almost any of them.
Counters vs tracers: two ways to see
Before the tour, one distinction that explains the whole diagram. Linux observability splits into two styles:
- Fixed counters — the kernel always keeps running totals (bytes read, packets sent, context switches, page faults). Tools like
vmstat,iostat,mpstat,sar,/procjust read and print those counters. Cheap, always available, but coarse — you get totals and rates, not individual events. - Tracing — you instrument a specific event (a function call, a syscall, a packet) and capture per-event detail. Tools like
strace,perf,Ftrace,BCC, andbpftracedo this. Far more powerful — you can see the exact slow I/O — but heavier, so you target a window.
The rule: start with counters to localise the problem, switch to tracing to nail the cause. Counters say "disk is busy and slow"; tracing says "process 1843 wrote the WAL and it took 90 ms." Almost every section below has both kinds.
Applications & system libraries
At the very top sit your programs and the libraries they call. The tools here watch the boundary between user code and the kernel.
strace — the syscall tracer
What: traces every system call a process makes, with arguments and return values. The single best way to answer "what is this program actually asking the kernel to do?" Catches a process spinning on a failing open(), hammering stat() on missing files, or blocking in read().
strace -p <PID>                  # attach to a running process
strace -c -p <PID>               # summary: count + time per syscall
strace -e trace=open,read,write -f program # filter + follow childrenstrace uses ptrace, which stops the target on every syscall — it can slow a busy process 100×+. Great on a dev box or a stuck process, dangerous on a hot production service. For low-overhead syscall tracing, use perf trace or a bpftrace syscall tracepoint instead.ltrace — the library-call tracer
What: like strace but for library calls (e.g. into glibc) rather than syscalls. Useful when the interesting logic is in a shared library — seeing which malloc/memcpy/SSL_read calls dominate. Same ptrace-based overhead caveat applies.
gethostlatency — DNS resolution latency
What: a BCC tool that traces calls to getaddrinfo/gethostbyname in the resolver library and times them. Slow or flaky DNS is a classic invisible latency source — a service that "randomly" stalls 5 seconds is often waiting on a DNS timeout. gethostlatency shows it directly.
The system-call interface
This thin yellow band is where user space crosses into the kernel. strace and perf trace both observe it. The reason it gets its own layer on the map: syscall rate and latency are a superb high-level health signal. A sudden spike in futex calls means lock contention; a flood of read/write means I/O pressure. perf trace -s -p <PID> gives a low-overhead syscall summary that's safe in production.
VFS, filesystems & the file path
The left blue stack — VFS, file systems, volume manager, block device — is the read/write path. These tools watch files and the filesystem.
| Tool | What it shows | Reach for it when… |
|---|---|---|
opensnoop | every open() with path + result | chasing config/temp-file churn or "file not found" errors |
lsof | all open files per process (snapshot) | "what is this process holding open?" / fd leaks |
fatrace | filesystem access events (open/read/write/close) system-wide | "what is touching the disk right now?" |
filelife | lifespan of short-lived files (created then deleted) | temp-file thrash from builds/compilers |
pcstat | page-cache residency of a file (% cached) | "is my hot data actually in RAM?" |
ext4slower / xfsslower / btrfsslower / nfsslower / zfsslower | filesystem operations slower than a threshold | slow reads/writes localised to a filesystem type |
ext4dist (and per-FS variants) | histogram of FS operation latency | the shape of FS latency — tail vs steady |
The *slower family is the workhorse. ext4slower 10 prints every ext4 operation over 10 ms with the process and file — it measures latency at the filesystem layer (above the disk), so it captures the full cost a process experiences, including cache misses and lock waits, not just raw device time.
ext4slower 10          # ext4 ops slower than 10 ms
ext4dist 1 5           # ext4 op latency histogram, 5x1s
opensnoop -p <PID>      # every file the process opens
The network stack
The middle green stack — sockets, TCP/UDP, IP, net device — has the densest tooling on the map, because networking has the most failure modes. Split it into counters and tracers.
Counters & socket state
| Tool | What it shows |
|---|---|
ss | socket statistics — connections, states, queues; ss -ti shows per-socket RTT, retransmits, congestion window |
nstat | kernel network counters (better netstat -s) — retransmits, drops, listen overflows |
netstat | legacy connections + protocol stats; mostly superseded by ss/nstat |
nicstat | per-NIC throughput & utilization — is the link saturated? |
ip | interface/route/address config + stats (ip -s link) |
ethtool | NIC driver stats & settings — errors, drops, ring sizes, offloads |
snmpget / lldptool | query device/switch info via SNMP / LLDP (topology, port state) |
Tracers
| Tool | What it shows |
|---|---|
tcpretrans | every TCP retransmit with addresses + state — packet loss on live connections |
tcplife | each connection's lifespan + bytes — spot short-lived connection thrash (add pooling) |
tcpconnect / tcpaccept | new outbound / inbound connections as they happen |
udpconnect | new UDP connections (e.g. DNS, QUIC) |
tcpdump | full packet capture — the deepest, heaviest network tool; use a filter |
ss -tiep                       # rich per-socket TCP state
nstat -az TcpRetransSegs       # retransmit counter
tcpretrans-bpfcc               # live retransmits
tcplife-bpfcc                  # connection lifespans + bytes
tcpdump -ni eth0 'port 5432' # capture Postgres traffic onlynstat tells you retransmits are happening (a counter is climbing); tcpretrans tells you which connections; ss -ti on those sockets shows RTT and congestion window; tcpdump is the last resort when you need the actual packets. Counter → tracer → capture, increasing in power and overhead.CPU & the scheduler
The orange "Scheduler" region plus the CPUs box on the right hold the largest cluster of tools, split between summary counters and per-event tracers.
Summary tools
| Tool | What it shows |
|---|---|
top / atop | per-process CPU/mem, refreshed live; atop also logs history |
ps | process snapshot — sort by CPU/mem (ps -eo pid,pcpu,comm --sort=-pcpu) |
pidstat | per-process CPU/IO/context-switch rates over intervals — better than top for trending |
mpstat | per-CPU utilization breakdown (%usr %sys %iowait %steal %idle) |
Read mpstat -P ALL 1 carefully: high %sys means kernel-heavy work, high %iowait means blocked on disk, and high %steal on a VM means the hypervisor is giving your vCPU away — the fingerprint of an overcommitted host or a noisy neighbour.
Tracers & profilers
| Tool | What it shows |
|---|---|
execsnoop | every new process exec — catch fork storms, surprise cron jobs, short-lived processes top misses |
profile | samples stacks at 99 Hz — where CPU cycles actually go (flame-graph input) |
runqlen | run-queue length over time — depth of the scheduler backlog |
offcputime | where threads block off CPU and for how long — the other half of latency |
softirqs / hardirqs | time spent in soft/hard interrupt handlers — NIC/timer/IRQ overhead |
criticalstat | traces atomic/critical sections that disable interrupts — latency spikes from the kernel itself |
The on-CPU/off-CPU pairing is the key idea: profile shows what burns CPU; offcputime shows what a thread waits on (locks, I/O, sleeps). A slow request is always one or the other. Together they explain all of it.
CPU hardware counters
| Tool | What it shows |
|---|---|
perf | the Swiss-army profiler — PMC events (cycles, instructions, cache misses, IPC), profiling, tracing |
tiptop | top-like view of per-process IPC and cache miss rates from PMCs |
turbostat | per-core frequency, C-states, temperature, power — is turbo engaging? |
showboost | quick view of current CPU clock vs base (boost behaviour) |
rdmsr | read model-specific registers directly — low-level CPU state |
IPC (instructions per cycle) is the number to know here. Low IPC (<1.0) with high CPU usage means the cores are stalled waiting on memory, not doing useful work — a sign you're memory-bound, and the fix is data layout / cache behaviour, not more cores. perf stat prints IPC for any command:
perf stat -p <PID> sleep 10      # cycles, instructions, IPC, cache misses
perf top                          # live system-wide profile
turbostat --interval 1            # frequency + C-states + power
Virtual memory
The lower orange "Virtual Memory" box covers RAM, paging, and the page cache.
| Tool | What it shows |
|---|---|
vmstat | system-wide memory, swap, I/O, CPU at a glance; watch si/so (swap in/out — should be ~0) |
free | total/used/free + buffers/cache; remember "available" matters more than "free" |
slabtop | kernel slab cache usage — where kernel memory goes (dentries, inodes) |
numastat | per-NUMA-node memory allocation & misses — local vs remote memory hits |
The trap with free: Linux deliberately uses "free" RAM for the page cache, so low free is normal and healthy. The number that matters is available (reclaimable) memory. And any nonzero, sustained so (swap-out) in vmstat on a database server is a red flag — paging out hot memory destroys latency.
The block / disk layer
The bottom-left path — block device, I/O controller, disks — is storage. This is where database WAL and checkpoint latency is born.
| Tool | What it shows |
|---|---|
iostat | per-disk throughput, IOPS, utilization, await; iostat -xz 1 is the staple |
biolatency | block-I/O latency histogram — the shape, including the killer tail |
biosnoop | per-I/O trace: process, sector, size, latency — one line per I/O |
biotop | top for disk I/O — which process does the most I/O |
blktrace | deep block-layer event trace — full lifecycle of each request |
mdflush | traces md (software RAID) flush events |
swapon | lists swap devices in use + their activity — is the box swapping, and to what? |
| SCSI log | kernel SCSI logging (via /proc/sys/dev/scsi/logging_level + dmesg) — low-level device errors/resets |
From iostat -xz 1, the columns that matter: %util (how busy the device is), await (average I/O latency in ms), and aqu-sz (average queue depth — saturation). High await with high %util = the disk is the bottleneck; confirm the shape with biolatency and find the culprit process with biotop.
iostat -xz 1                   # per-disk extended stats
biolatency-bpfcc 1 5           # latency histogram
biosnoop-bpfcc                 # per-I/O trace
biotop-bpfcc                   # top processes by disk I/O
swapon --show                  # swap devices + usage
Two map items live at the very bottom, next to the disks. swapon (with --show) lists which swap devices are active and how full they are — the static companion to vmstat's si/so: if the box is swapping, this tells you where it swaps, and swap on a slow disk turns memory pressure into a latency disaster. SCSI logging is the deepest storage-error view: bump /proc/sys/dev/scsi/logging_level and the kernel logs SCSI command detail (errors, retries, device resets) to dmesg — the place to look when a disk is throwing errors below the filesystem and biolatency shows random latency spikes from retries.
Hardware: memory bus & DRAM
On the far right, the CPUs–DRAM link is observed by tiptop and perf (memory-stall events) and numastat (NUMA locality). The question they answer: is the workload waiting on memory? On modern multi-socket servers, remote-NUMA memory access can be 1.5–2× slower than local — numastat exposes whether your process is hitting far memory, which ties directly into the tuning chapter's NUMA pinning.
The four tracers on the left
Down the left edge of the diagram sit the heavy hitters that can instrument almost any layer: perf, Ftrace, LTTng, BCC, bpftrace. They're listed separately because they're not single-purpose — they're frameworks.
| Framework | Strength |
|---|---|
| perf | profiling + PMCs + tracepoints; ships with the kernel; the default profiler |
| Ftrace | built-in function tracer; lightweight, great for kernel function flow |
| LTTng | high-volume, low-overhead tracing for production trace collection |
| BCC | Python front-end to eBPF; the ready-made tools (biolatency, execsnoop, …) |
| bpftrace | awk-like eBPF one-liners; fast custom tracing and the BCC fallback |
The eBPF pair (BCC + bpftrace) is the modern centre of gravity — most of the named tools in this chapter (biolatency, execsnoop, tcplife, ext4slower) are BCC/bpftrace tools. We devoted a whole separate post to using five of them against a live database; see the link in Extra Reads.
Various: the always-on counters
Top-right of the map: sar, /proc, dmesg, dstat. These read fixed counters and are available on every box, no extra packages.
sar— the System Activity Reporter. Records and replays historical counters across every subsystem. So important it gets its own chapter (Part 5)./proc— the kernel's data export as files. Every tool above ultimately reads/procand/sys; you cancatthem directly (/proc/stat,/proc/meminfo,/proc/<pid>/status).dmesg— kernel ring buffer; OOM kills, disk errors, segfaults, hardware faults land here first.dstat— colourful combined live view of CPU/disk/net/memory; a friendliervmstat+iostat.
Tying it together: the USE method
A map of tools is only useful with a route through it. Gregg's USE method is that route: for every resource, check Utilization, Saturation, and Errors. Run it top-down and the diagram's tools fall into place:
| Resource | Utilization | Saturation | Errors |
|---|---|---|---|
| CPU | mpstat, top | runqlat, runqlen | perf, dmesg |
| Memory | free, vmstat | vmstat si/so, sar -B | dmesg (OOM) |
| Disk | iostat %util | iostat aqu-sz, biolatency | dmesg, SMART |
| Network | nicstat | ss -ti, nstat | ethtool -S, nstat |
"Saturation" is the column that catches what utilization misses — the queueing. A CPU at 40% can still have threads waiting in the run queue; a disk at 60% util can have a latency tail. Always check all three columns, and the diagram becomes a checklist instead of a memory test.
A 60-second triage sweep
When you're paged and need a fast read, Gregg's "first 60 seconds" sequence touches one tool per subsystem:
uptime                 # load averages — trend over 1/5/15 min
dmesg | tail           # recent kernel errors (OOM, disk, drops)
vmstat 1               # memory, swap, CPU; watch si/so and r
mpstat -P ALL 1        # per-CPU balance; watch %steal, %iowait
pidstat 1              # which processes are hot, over time
iostat -xz 1           # per-disk util + await
free -m                # memory headroom (look at available)
sar -n DEV 1           # per-NIC throughput
sar -n TCP,ETCP 1      # TCP connection + retransmit rates
top                    # the overview, last
Each command maps to a layer on the diagram. If one lights up — high %steal, climbing retransmits, a disk pegged at 100% util with high await — that's your lead, and you drop to the matching tracer (runqlat, tcpretrans, biolatency) to nail it. This sweep is the diagram, walked top to bottom.
Hands-on: try these now
Tool names mean nothing until you run them. Here are worked examples for the headline tools — the exact command, what the output looks like, and the decision you make from it. Run them on a test box (most counters need no root; the tracers need root).
CPU — is a core saturated?
mpstat -P ALL 1CPU %usr %sys %iowait %steal %idle
all 42.1 8.3 1.0 0.0 48.6
0 98.0 2.0 0.0 0.0 0.0 <- core 0 pegged
1 5.1 1.0 0.0 0.0 93.9
2 4.8 0.9 0.0 0.0 94.3
3 3.2 1.1 0.0 0.0 95.7Read it: "all" looks fine at 48% idle, but core 0 is at 0% idle — a single-threaded hotspot. Do this: the workload isn't using your cores; find the busy thread and consider parallelising or pinning (Part 4). If instead %steal were high, the hypervisor is stealing cycles — noisy neighbour, move instances.
CPU — where are the cycles going? (flame graph)
# find the busiest PID, then profile it for 30s at 99 Hz
ps -eo pid,pcpu,comm --sort=-pcpu | head -3
sudo profile-bpfcc -F 99 -p <PID> 30 -f > out.stacks
# turn it into a flame graph
git clone https://github.com/brendangregg/FlameGraph && cd FlameGraph
./flamegraph.pl ../out.stacks > cpu.svg   # open cpu.svg in a browser
Read it: the widest tower in the flame graph is where CPU time goes. Do this: if it's ExecSort in Postgres, add an index or raise work_mem; if it's JSON serialization, cache it. The flame graph turns "CPU is high" into "this function is the cost."
Disk — is storage the bottleneck?
iostat -xz 1Device r/s w/s rkB/s wkB/s await aqu-sz %util
nvme0n1 12.0 840.0 192.0 53760 24.8 18.4 99.2Read it: %util 99% + await 24.8 ms + queue depth 18 = the disk is saturated and every I/O waits ~25 ms. Do this: confirm the shape with biolatency, find the culprit with biotop:
sudo biolatency-bpfcc 1 1     # is it a tail or uniformly slow?
sudo biotop-bpfcc             # which process issues the I/O?
usecs : count distribution
1024 -> 2047 : 410 |******** |
16384 -> 32767 : 980 |**********************| <- 16-32 ms humpA second hump at 16–32 ms = a real latency tail. If biotop names a backup job, throttle it with ionice (Part 4); if it's the database WAL, you've hit the volume's IOPS ceiling — bump the tier or move pg_wal.
Scheduler — threads waiting for a CPU?
sudo runqlat-bpfcc 1 1 usecs : count distribution
0 -> 1 : 1200 |**********************|
2048 -> 4095 : 540 |********* | <- 2-4 ms waits
4096 -> 8191 : 120 |** |Read it: most wakeups schedule instantly (0–1 µs), but a real chunk waits 2–4 ms for a CPU — saturation that top's averages hide. Do this: reduce concurrency, add cores, or pin the latency-sensitive process to dedicated cores so it never queues.
Network — packet loss on a live connection?
sudo tcpretrans-bpfccTIME PID LADDR:LPORT RADDR:RPORT STATE
04:12:09 1843 10.0.0.5:5432 10.0.0.9:51120 ESTABLISHED
04:12:11 1843 10.0.0.5:5432 10.0.0.9:51120 ESTABLISHEDRead it: retransmits on port 5432 (Postgres) to a replica = real packet loss on live DB traffic, each costing a ~200 ms timeout. Do this: check NIC errors with ethtool -S eth0 | grep -i err and the socket with ss -ti (look at the retrans and rtt fields); chase a flapping link or undersized ring buffers.
Processes — catch what top can't see
sudo execsnoop-bpfccPCOMM PID PPID RET ARGS
sh 28341 9012 0 /bin/sh -c /opt/healthcheck.sh
curl 28342 28341 0 /usr/bin/curl -s localhost:9000/healthRead it: a healthcheck forking sh+curl every second — invisible to top because each process lives milliseconds, but it adds up as load. Do this: replace the fork-per-check with an in-process check, or lengthen the interval.
Memory — is it swapping?
vmstat 1 r b swpd free buff cache si so bi bo
2 0 98304 20144 3120 891234 0 512 8 640 <- so=512Read it: nonzero so (swap-out) means the kernel is paging memory to disk — on a database this destroys latency. Do this: find the memory hog, lower vm.swappiness to 1 (Part 4), and check free -m's available column (not "free").
Takeaways
- The diagram is an index, not a poster. Its value is mapping a symptom to a layer to a tool — picture where the problem lives, and the tool names itself.
- Counters localise, tracers diagnose. Start cheap and system-wide (
vmstat,iostat,sar); escalate toperf/BCC/bpftrace once you know the layer. - Saturation is the hidden metric. Utilization-only tools miss queueing;
runqlat,iostat aqu-sz, andss -tiexpose it. - eBPF is the modern core. Most named tracers here are BCC/bpftrace — learn those and you've learned half the map.
- Walk it with the USE method. Utilization, Saturation, Errors, per resource, top to bottom — a route, not a guess.
References
- Brendan Gregg — Linux Performance — the source of every diagram in this series.
- The USE Method (Linux checklist) — the route through the map.
- Linux Performance Analysis in 60,000ms — the triage sweep.
- BCC Tools — biolatency, execsnoop, tcplife, and the rest.
Extra reads
- eBPF for Database Troubleshooting — five of these tracers against a live PostgreSQL.
- Part 2 — Static Performance Tools — the config side of the same map.
- Part 5 — sar in depth — the always-on historical counter tool.
Built from Brendan Gregg's "Linux Performance Observability Tools" diagram (linuxperf.html, 2021). Tool availability varies by distro and kernel; the *-bpfcc suffix is Ubuntu/Debian packaging. Always confirm overhead on a non-production box before tracing a hot service.