TL;DR — Observability watches load you already have; benchmarking generates load on purpose to measure a ceiling. Gregg's Benchmark Tools map pins a load generator to every layer — fio/dd for disks, iperf/hping3 for the network, sysbench/lmbench for CPU and memory, wrk/ab/jmeter for applications, MLPerf for accelerators. This chapter walks each, explains what it actually stresses, the right way to run it, and the traps that turn benchmarks into lies. The golden rule: always run an observability tool alongside the benchmark — a number without a bottleneck is half a result.
Active vs passive: why benchmark at all
Every tool in Parts 1 and 2 was passive — it watched what the system was already doing. Benchmark tools are active: they apply a controlled, repeatable load so you can measure a limit you don't currently see. You benchmark to answer "how fast can this go?", to compare two configs or two machines fairly, and to prove a tuning change actually helped (the before/after).
The structure of the diagram is the same system stack, but now each box has a tool that drives it to saturation rather than observing it. And the most important discipline isn't picking the tool — it's pairing it. While the benchmark runs, you watch with the Part 1 tools. The benchmark gives you the throughput number; the observability tool tells you what limited it — CPU, disk, network, or lock contention. Without the pairing you get a number and no story.
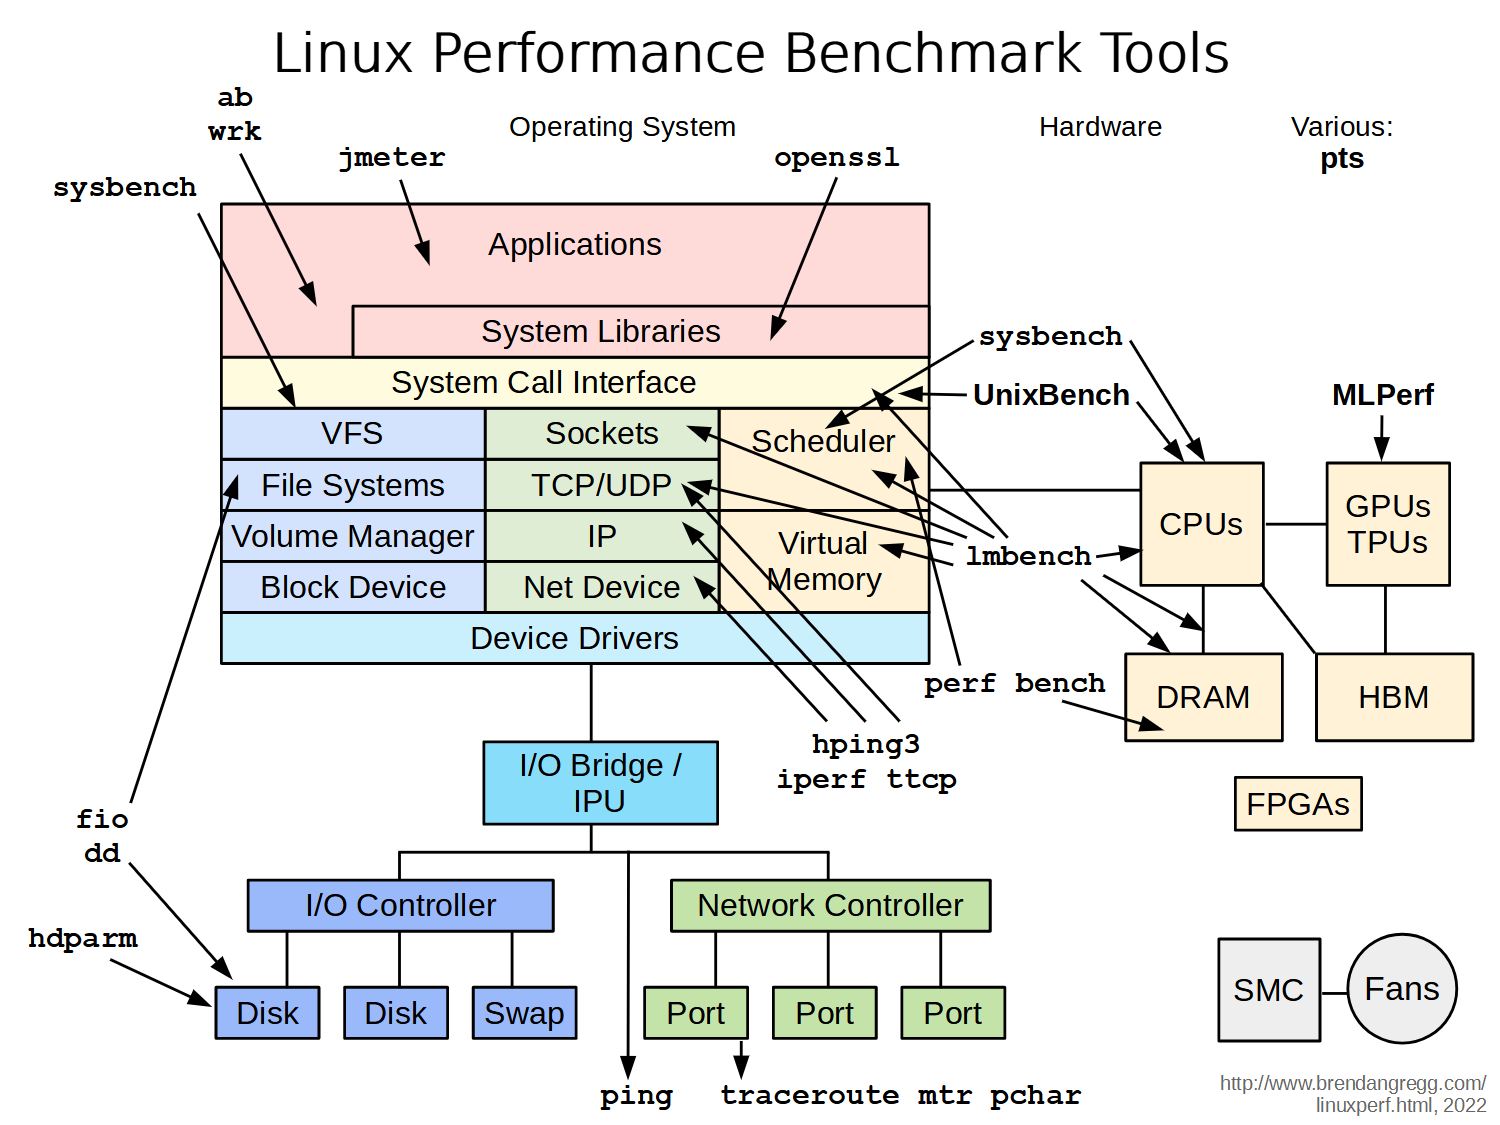
The original — Brendan Gregg's "Linux Performance Benchmark Tools" (brendangregg.com, 2022). The simplified diagram below walks it box by box.
Fig 1 — A load generator per layer. Run one to saturate a resource; watch with Part-1 tools to see what gave way first.
The three benchmark traps (read first)
Before any tool, the failure modes — because a wrong benchmark is worse than none, it's a confident lie:
- Benchmarking the wrong thing. The classic: a "disk" benchmark that actually measures the page cache because the dataset fit in RAM.
ddreading a file you just wrote returns memory speed, not disk speed. UseO_DIRECT/ drop caches / a dataset bigger than RAM. - Ignoring variance. One run is noise. Cloud neighbours, turbo boost, thermal throttling, and background jobs all move the number. Run many times, report median and spread, and warm up first.
- Coordinated omission. A load generator that pauses its clock while the server is slow under-reports tail latency massively. Tools like
wrk2fix this with a fixed request rate; plainwrk/abcan hide your worst p99.
Disk & filesystem benchmarks
| Tool | What it stresses |
|---|---|
fio | the serious one — configurable I/O: random/sequential, read/write, block size, queue depth, direct I/O |
dd | crude sequential throughput; handy but easy to misuse (cache!) |
hdparm -t | quick cached/buffered read speed of a device |
fio is the standard. It models real workloads — "70/30 random read/write, 8K blocks, queue depth 32, direct I/O" looks a lot like a database. The key knobs: --rw (pattern), --bs (block size — small random is the hard case), --iodepth (concurrency), and crucially --direct=1 to bypass the page cache so you measure the device, not RAM.
# database-like random I/O, bypassing cache
fio --name=randrw --rw=randrw --rwmixread=70 --bs=8k \
    --iodepth=32 --direct=1 --size=10G --runtime=60 --time_based \
    --filename=/data/testfile
# crude sequential (note: drop caches first or it lies)
sync; echo 3 | sudo tee /proc/sys/vm/drop_caches
dd if=/dev/zero of=/data/tf bs=1M count=10000 oflag=direct
While it runs, watch iostat -xz 1 and biolatency (Part 1). If fio reports 50k IOPS but iostat shows the device at 100% util with high await, that's your real ceiling — the device, not the benchmark, is the limit.
Network benchmarks
| Tool | What it stresses |
|---|---|
iperf / iperf3 | TCP/UDP throughput between two hosts — the standard bandwidth test |
hping3 | crafted packets — custom TCP/UDP/ICMP, latency probing, firewall testing |
ttcp | old-school throughput test (precursor to iperf) |
ping | round-trip latency + loss — the simplest network signal |
traceroute / mtr | per-hop path + latency; mtr = continuous traceroute+ping |
pchar | per-hop bandwidth estimation along a path |
iperf3 answers "what's the real throughput between these two boxes?" Run a server on one (iperf3 -s), client on the other (iperf3 -c host). Parallel streams (-P) reveal whether a single flow is limited (often by a single CPU handling the NIC IRQ) versus the link itself. UDP mode (-u -b) tests at a fixed rate and reports loss/jitter — closer to real-time workloads.
# server side:
iperf3 -s
# client: 4 parallel TCP streams, 30s
iperf3 -c 10.100.43.121 -P 4 -t 30
# UDP at 1 Gbit, report loss + jitter
iperf3 -c 10.100.43.121 -u -b 1G
# path + latency:
mtr -rwc 100 10.100.43.140
mtr is the diagnostic complement: when iperf underperforms, mtr shows where on the path loss or latency creeps in — a single bad hop, often a congested link or an overloaded router. Pair with ethtool -S (Part 2) to check NIC-level drops on your own side.
CPU & memory benchmarks
| Tool | What it stresses |
|---|---|
sysbench | multi-mode: CPU (prime numbers), memory bandwidth, threads, and a built-in OLTP DB test |
lmbench | micro-benchmarks: memory latency by level, syscall cost, context-switch time, bandwidth |
UnixBench | classic composite system score (dhrystone, whetstone, pipe, process spawn) |
perf bench | built into perf — scheduler, memory, futex, syscall micro-benchmarks |
openssl speed | crypto throughput — AES, RSA, SHA; great for AES-NI / cipher comparisons |
sysbench is the everyday CPU/memory tool. sysbench cpu measures integer/prime throughput and scales cleanly with threads — a quick way to compare cores or confirm all cores are usable. sysbench memory measures bandwidth, which on NUMA boxes is sensitive to placement (run it under numactl to see local vs remote).
# CPU: single vs all cores
sysbench cpu --cpu-max-prime=20000 --threads=1 run
sysbench cpu --cpu-max-prime=20000 --threads=$(nproc) run
# memory bandwidth
sysbench memory --memory-block-size=1M --memory-total-size=100G run
# memory latency hierarchy:
lmbench  # lat_mem_rd shows L1/L2/L3/DRAM latency steps
# crypto:
openssl speed -evp aes-256-gcmlmbench's lat_mem_rd is the most educational micro-benchmark on the map: it walks increasing memory sizes and plots latency, producing visible "steps" at each cache level (L1 ~1ns, L2 ~4ns, L3 ~15ns, DRAM ~80ns+). That curve is your memory subsystem, and it explains why cache-friendly data layout matters more than clock speed for many workloads.
turbostat (Part 1) while running CPU benchmarks. If the score is lower than expected, turbostat may show the cores never reached turbo (governor in powersave — Part 4) or thermal-throttled. The benchmark number alone wouldn't tell you which.Application & HTTP load
| Tool | What it stresses |
|---|---|
wrk / wrk2 | high-throughput HTTP load; wrk2 fixes coordinated omission with a target rate |
ab (ApacheBench) | simple HTTP load — quick single-URL test, limited concurrency model |
jmeter | full GUI/scriptable load testing — complex multi-step user flows, assertions |
openssl s_time | TLS handshake throughput — connection-setup cost |
wrk is the go-to for raw HTTP throughput: low overhead, Lua-scriptable requests, reports latency distribution. But for latency claims, use wrk2 — it drives a constant request rate and measures latency against the intended schedule, so a slow server's tail shows up instead of being hidden. jmeter is heavier but earns its weight when you need realistic multi-step flows (login → search → checkout) with think-time and assertions.
# wrk: 4 threads, 100 connections, 30s
wrk -t4 -c100 -d30s https://app.local/api/health
# wrk2: fixed 10k req/s to expose true tail latency
wrk2 -t4 -c100 -d30s -R10000 https://app.local/api/health
# ab: 10k requests, 50 concurrent
ab -n 10000 -c 50 https://app.local/
Run these against a service and watch the server with pidstat, mpstat, and runqlat. The load tool gives requests/sec and latency percentiles; the server-side tools tell you whether you hit a CPU wall, lock contention (off-CPU), or a downstream database limit. That pairing is the difference between "the app does 20k rps" and "the app does 20k rps, CPU-bound on JSON serialization, here's the flame graph."
Accelerators: GPUs & TPUs
Top-right of the map: MLPerf. As ML workloads moved onto the same servers, the benchmark map grew a hardware-accelerator box. MLPerf is the industry-standard suite for training and inference across GPUs/TPUs — standardised models and datasets so vendor claims are comparable. For day-to-day GPU checks you'd also reach for vendor tools (nvidia-smi for utilization/memory, framework micro-benchmarks for kernel throughput), but MLPerf is the apples-to-apples comparison when choosing accelerators.
Various: the meta-suite
Top-right: pts — the Phoronix Test Suite. Rather than one tool, it's a harness wrapping hundreds of benchmarks (CPU, memory, disk, GPU, compile, encode) with automated install, run, and result tracking. Use it for broad system characterisation and cross-machine comparison when you want many workloads with one command and a reproducible result database. The trade-off: less control than running fio/sysbench directly, so it's for breadth, not surgical investigation.
Running a benchmark that doesn't lie
A repeatable recipe regardless of tool:
- Isolate. Quiet the box — stop cron, other tenants, background jobs. On cloud, accept variance and run more iterations.
- Size past cache. Dataset bigger than RAM for disk; flush caches; use
--directwhere it exists. - Warm up. Discard the first run (JIT, cache fill, turbo ramp).
- Repeat & report spread. 5–10 runs, report median and range, not a single hero number.
- Pair with observability. Run
iostat/mpstat/pidstat/turbostatalongside; capture what saturated. - Fix one variable. Change one thing between runs; otherwise you can't attribute the delta.
# template: benchmark + observe together
iostat -xz 1 > iostat.log &
mpstat -P ALL 1 > mpstat.log &
fio --name=test ... # the benchmark
kill %1 %2          # stop the observers
# now correlate the fio result with the iostat/mpstat traces
Hands-on: run a benchmark that doesn't lie
Each example pairs the load generator with an observability tool (Part 1) so you capture both the number and the bottleneck. Run on a quiet test box.
Disk — fio, the right way (bypass cache)
# database-like: 70/30 random read/write, 8K, queue depth 32, direct I/O
fio --name=db --rw=randrw --rwmixread=70 --bs=8k --iodepth=32 \
    --direct=1 --size=10G --runtime=60 --time_based --filename=/data/tf
# in another terminal, watch the device:
iostat -xz 1
read: IOPS=48.2k BW=377MiB/s lat (usec): avg=410
write: IOPS=20.6k BW=161MiB/s lat (usec): avg=520
# iostat at the same time: %util=99.0 await=0.55 aqu-sz=31.8Read it: 48k read IOPS, and iostat shows the device pegged at 99% util — so this is the real ceiling, not a cache artifact (the --direct=1 guarantees it). Do this: compare runs across instance types; rank by IOPS-per-dollar. Drop --direct=1 and the number triples — that's the cache lying.
Network — iperf3 between two hosts
# on the server:
iperf3 -s
# on the client — 4 parallel streams, 30s:
iperf3 -c 10.0.0.5 -P 4 -t 30
[SUM] 0.00-30.00 sec 32.8 GBytes 9.39 Gbits/sec receiverRead it: 9.39 Gbit/s on a 10 GbE link = near line rate, healthy. Do this: if a single stream (-P 1) is much slower than 4, one CPU is the limit (NIC IRQ on one core) — spread it with RSS (Part 4). If all streams underperform, run mtr to find the bad hop.
CPU & memory — sysbench, single vs all cores
sysbench cpu --cpu-max-prime=20000 --threads=1 run | grep 'events per second'
sysbench cpu --cpu-max-prime=20000 --threads=$(nproc) run | grep 'events per second'
# watch clocks while it runs:
turbostat --interval 1 2>/dev/null | grep -E 'Busy|Bzy_MHz' | head
1 thread: events per second: 1184.5
64 threads: events per second: 71203.8 (~60x — good scaling)Read it: ~60× from 64 threads = near-linear scaling, all cores usable. Do this: if scaling is poor, turbostat shows whether cores hit turbo — a powersave governor (Part 2/4) or thermal throttling caps the score, and the benchmark number alone wouldn't tell you which.
HTTP — wrk2 for honest tail latency
# constant 10k req/s exposes the true tail (no coordinated omission)
wrk2 -t4 -c100 -d30s -R10000 --latency https://app.local/api/health
# watch the server side:
pidstat -p $(pgrep -f myapp) 1
Requests/sec: 9998.3
Latency Distribution:
50% 2.10ms
99% 48.30ms <- the tail wrk (not wrk2) would hideRead it: p50 is 2 ms but p99 is 48 ms — plain wrk/ab pause their clock when the server stalls and would report a far rosier p99. Do this: profile the server during the run (profile-bpfcc) to see what causes the tail — usually a lock or GC pause.
Takeaways
- Benchmarking is active observability. Generate load to find a ceiling you can't otherwise see; compare configs and prove changes.
- One tool per layer:
fio(disk),iperf3(net),sysbench/lmbench(CPU/mem),wrk2(HTTP),MLPerf(accelerators),pts(broad sweep). - Always pair with a Part-1 tool. The benchmark gives the number; observability gives the bottleneck. Both, or it's half a result.
- Avoid the three traps: measuring cache instead of device, trusting one run, and coordinated omission hiding the tail.
- Method > tool. Isolate, size past cache, warm up, repeat, fix one variable — see the Cloud Benchmarking series for the full discipline.
References
- Brendan Gregg — Linux Performance — source of the Benchmark Tools diagram.
- fio documentation — the flexible I/O benchmark.
- wrk2 — constant-rate HTTP load, no coordinated omission.
- MLPerf (MLCommons) — accelerator benchmarks.
Extra reads
- Benchmarking Basics — the metrics and traps in depth.
- Benchmark Your Own Workload — the org method, not a leaderboard.
- Part 4 — Tuning Tools — act on what the benchmark exposed.
Built from Brendan Gregg's "Linux Performance Benchmark Tools" diagram (linuxperf.html, 2022). Benchmark results are only meaningful with controlled conditions and paired observability; numbers here are illustrative of usage, not claims.